
Sortino ratioRisk return efficiency
This case study is password protected.
Need access? Email ishitabhorework@gmail.com
Most mutual fund investors know one number: their returns. MF insights is 1% Club’s AI CFO for everything else. It explains, and never advises.
High reach, low depth: people opened MF insights and left without reading it. 3.7 min average weekly time, down 20% week on week.
Lead every number with a plain-English reading, written up to the edge of advice and never over it.
The leaner layout won its A/B test. After launch, thousands a month go from a reading into the AI CFO, and WAU/MAU held at ~30% while the audience grew 4×.
It reads every fund you hold and leads with a plain-English reading, then the numbers. It explains. It never advises.


Most members can tell you their returns. Few can tell you if they’re doing okay. The gap hides in fees, overlap and weaker funds.
How am I doing against the market?
Am I taking more risk than I should?
Am I paying too much in hidden fees?
Do my funds repeat each other?
Where do I stand on tax this year?
The questions investors couldn’t answer, from the PRD. The feature exists to answer them.
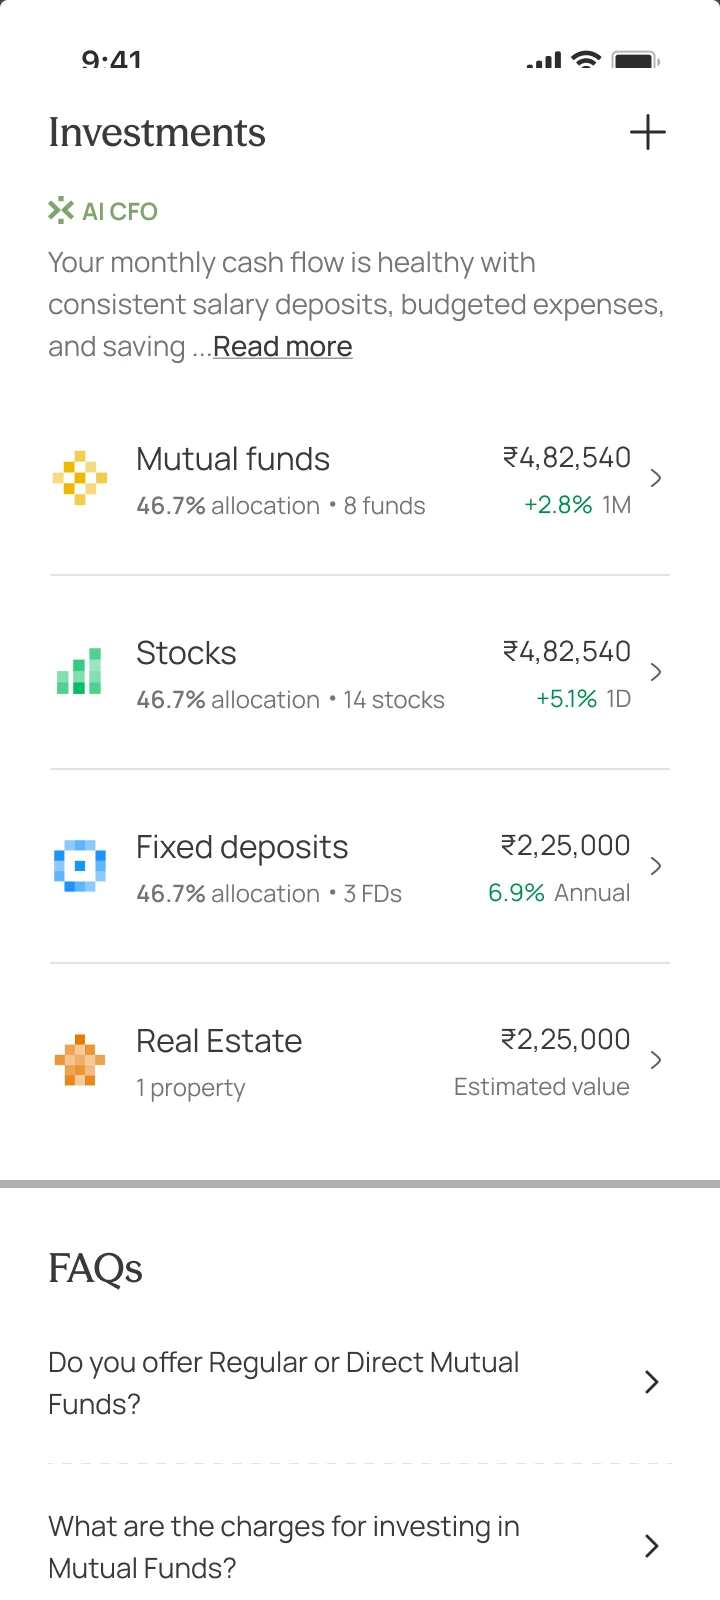
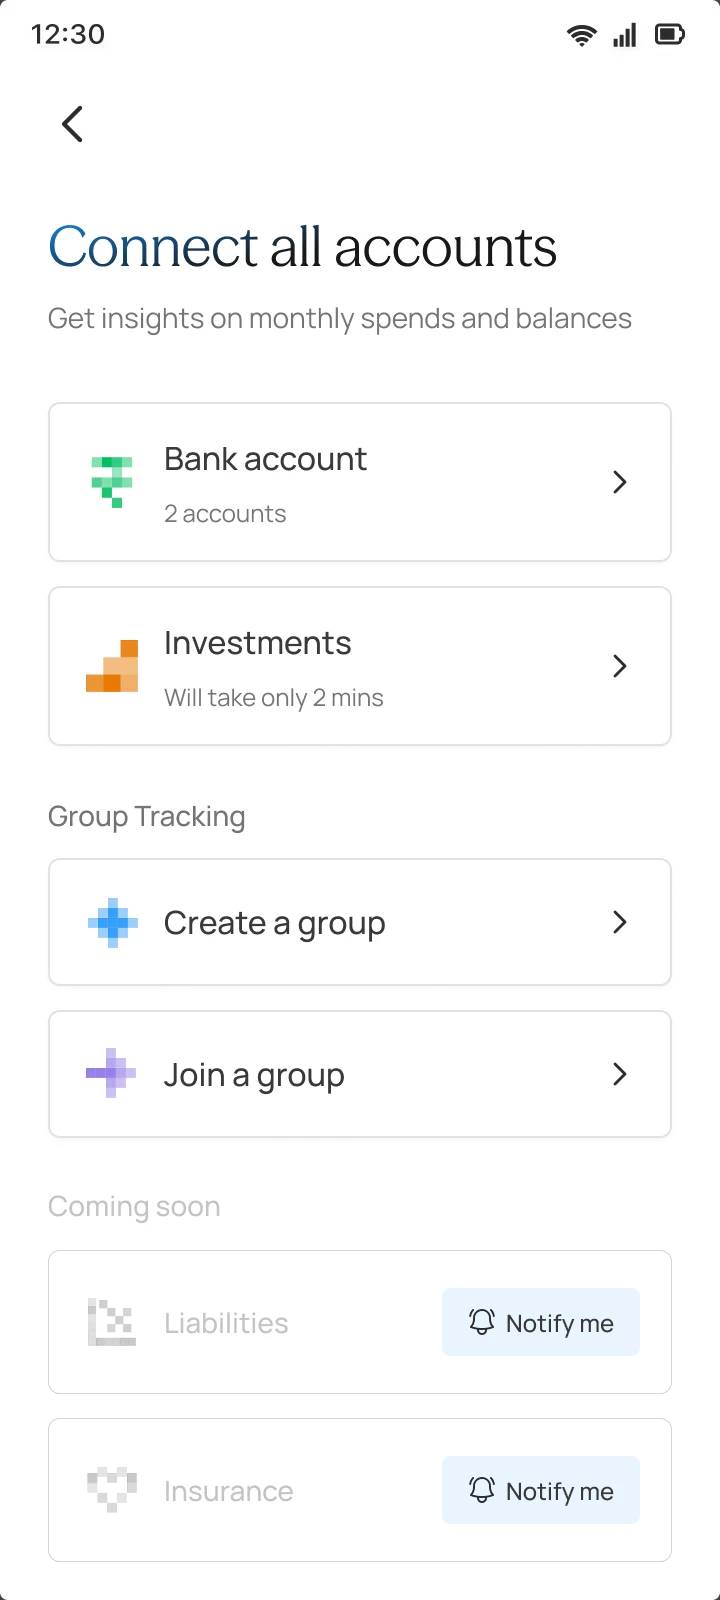

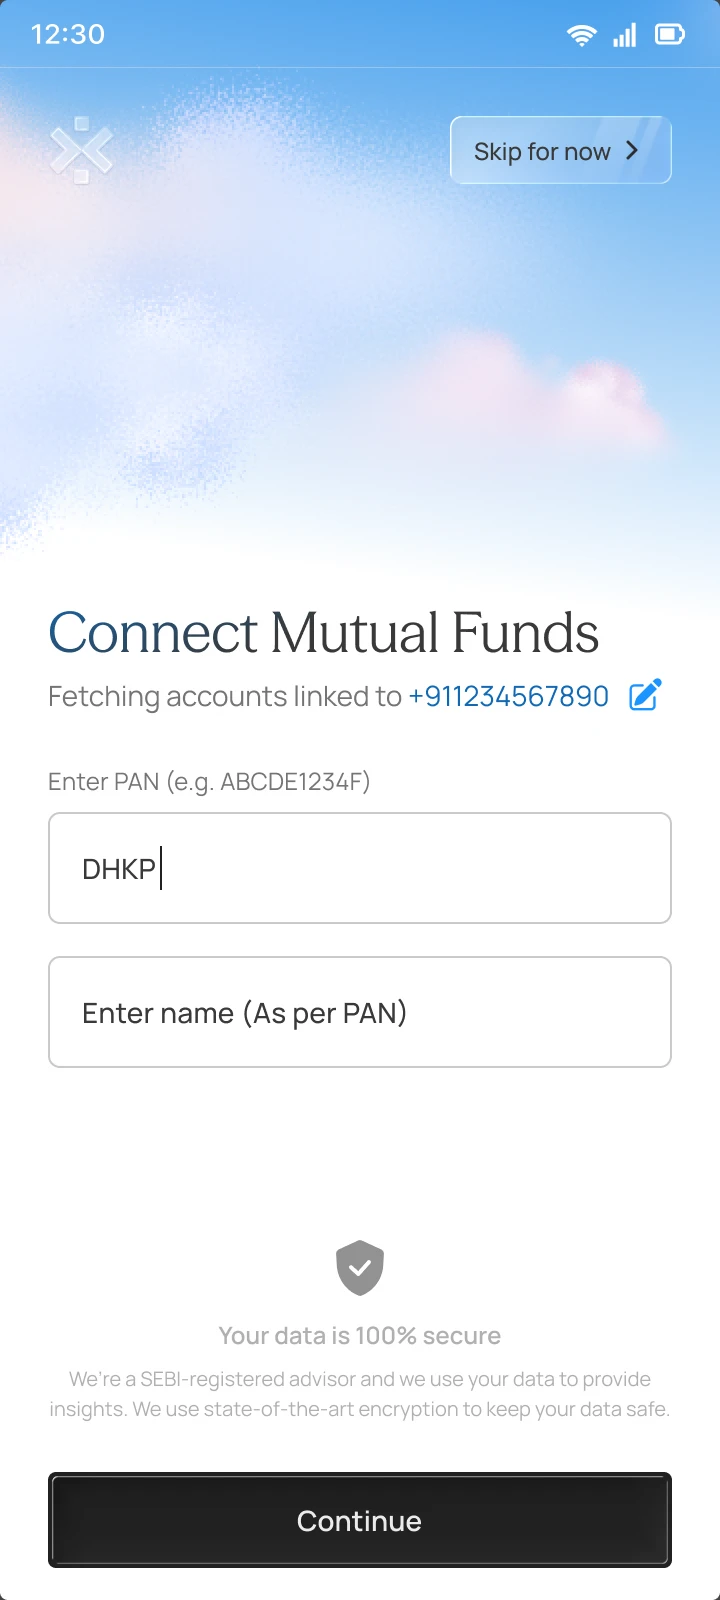


Every check got its own widget, across four carousels. People arrived from three entry points, then fell away at every step.
Each dot is a visit · from the audit
Version one went granular: Sortino ratios, rolling win rates, overlap down to the stock. Every chart was accurate. None said whether a number was good or bad, or what to do about it.

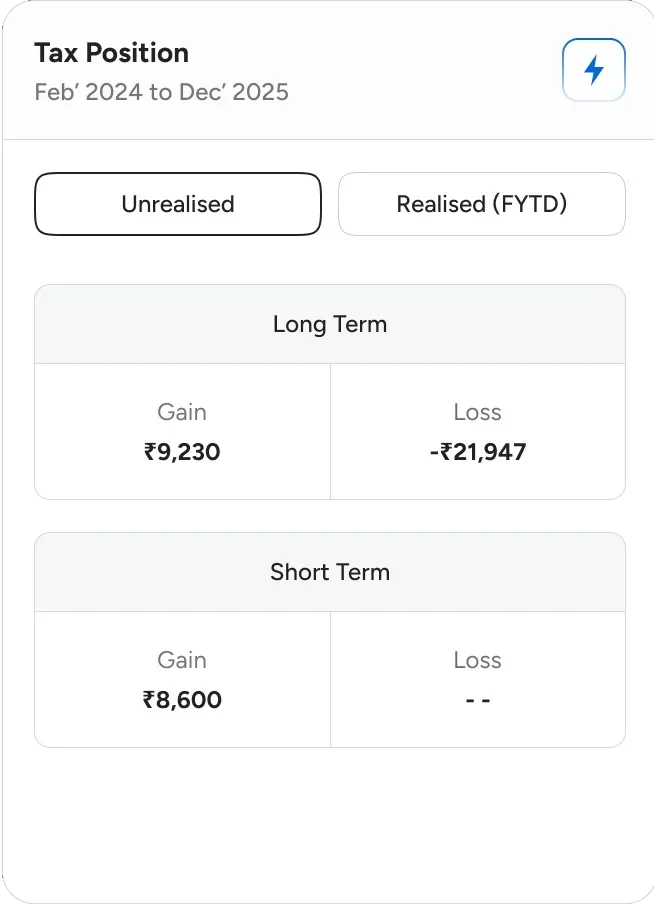

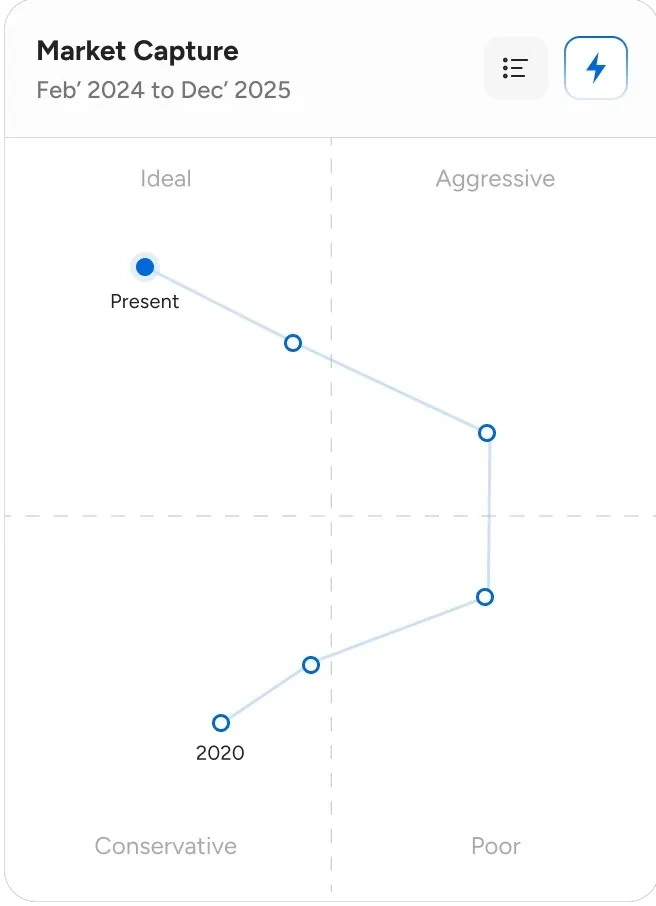

The pattern held across every check: people tapped what they could already read.
Tooltips and a glossary. The dense screen got denser.
People still had to guess which number deserved the tap.
Metric, meaning, one next step. Shipped.
First a glossary, then the meaning one tap down. Both left people doing the hard part. The third flipped it: the meaning leads, and the chart is the evidence.
Trade-offA copy rule for every state, and a compliance read on every sentence.


Overlap, allocation and cost had under 2% of taps, but investors can act on them, so they stayed. Risk-return, consistency, market capture and loss recovery were tapped more, but they grade the fund manager, not the investor. They went.
Trade-offFour widgets people did use went, including risk-return at 13.8% of taps. The A/B test backed it.


Recommending what to buy or sell is regulated advice in India. So compliance and I drew a line: explain and interpret, never recommend. A fund gets its category rank, never a verdict to exit.
Trade-offReadings sound careful on purpose. People who want to act decide on their own, and some will go elsewhere for advice.
“Switch to ICICI Nifty 50.”
“ICICI Index Nifty 50 ranks #1 of 24 in Large Cap.”
“Drop these 4 funds.”
“4 of your 12 funds rank in the bottom half of their category over three years.”
“Sell these units to save tax.”
“You have ₹17,830 in unrealised gains. For what to sell, check with a tax professional.”
Each section answers one question, so each got the form that answers it fastest.
Trade-offThree chart types to learn on one screen. Market cap moved from a pie to bars, because the pie made very different shares look alike.
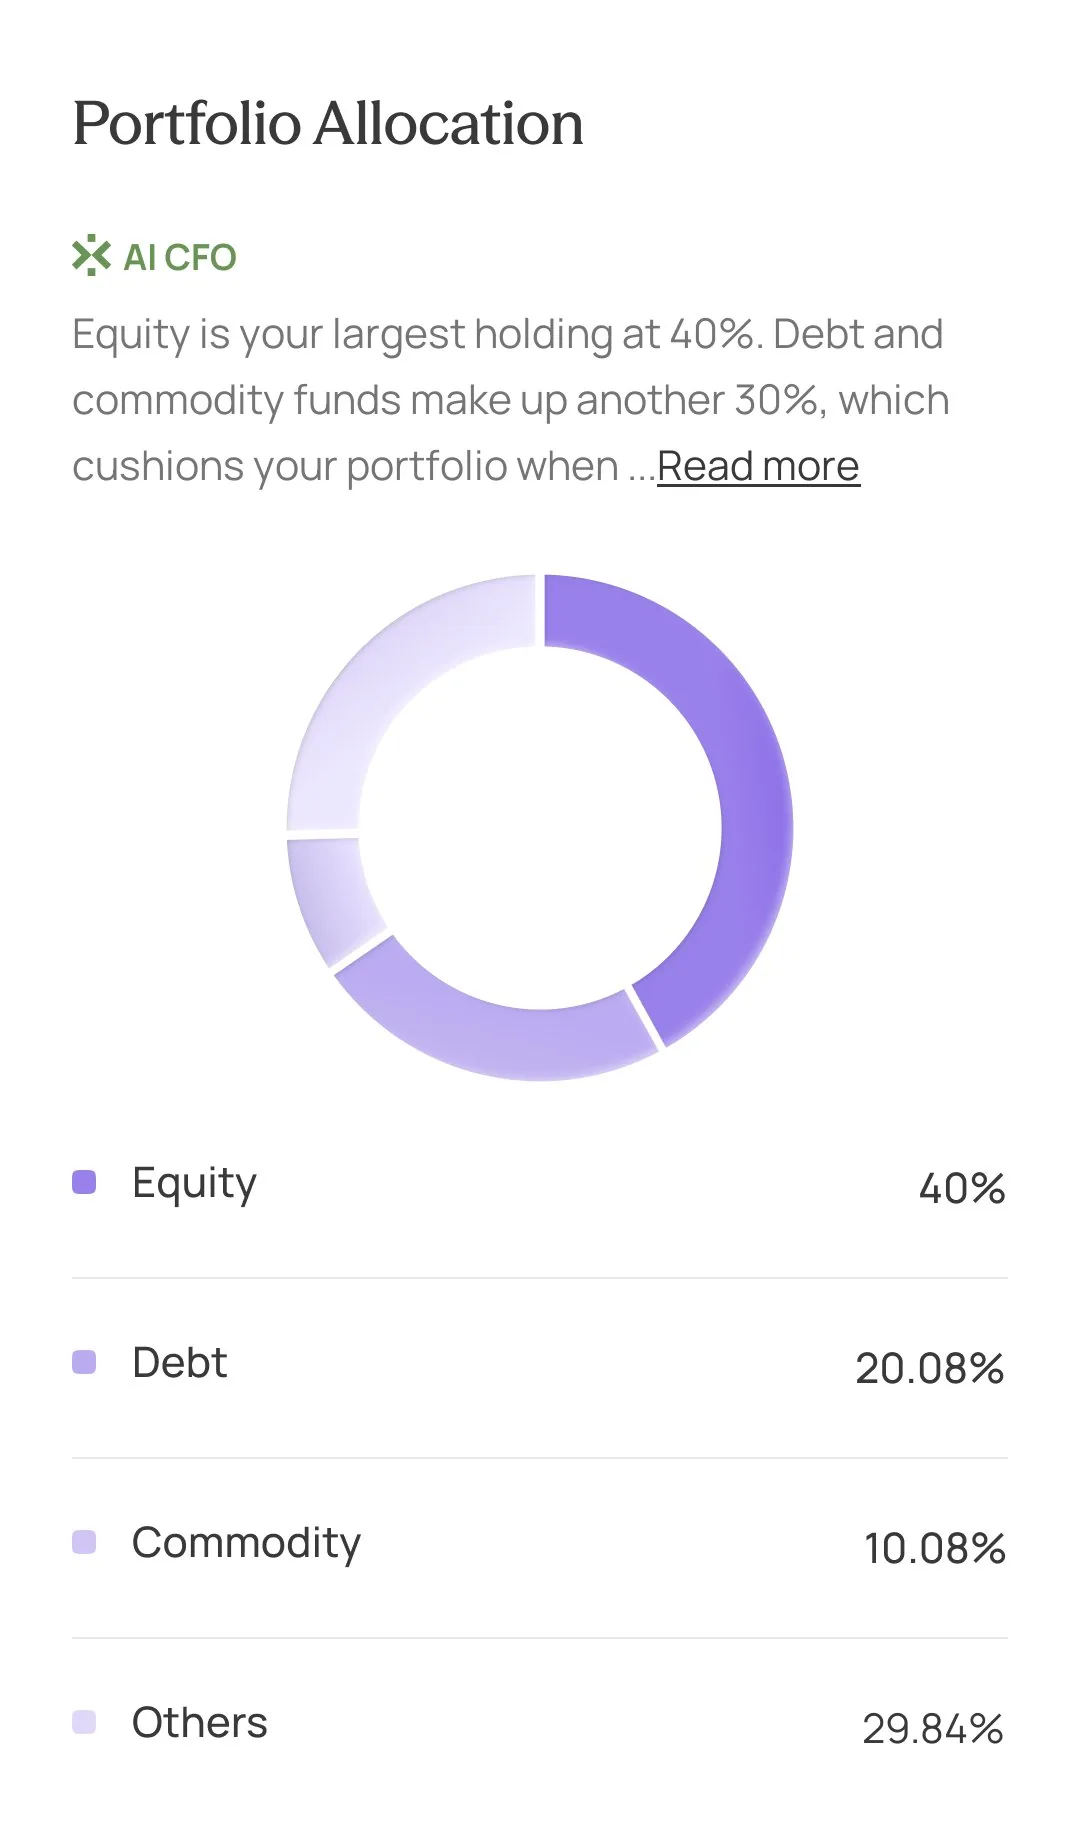
A mix with one dominant slice. The legend carries the exact numbers.

Market cap, sector and top holdings as bars, so close shares still look different.

One yearly number first, split into direct and regular plans underneath.
Overlap is literally shared holdings. The shape is the concept.

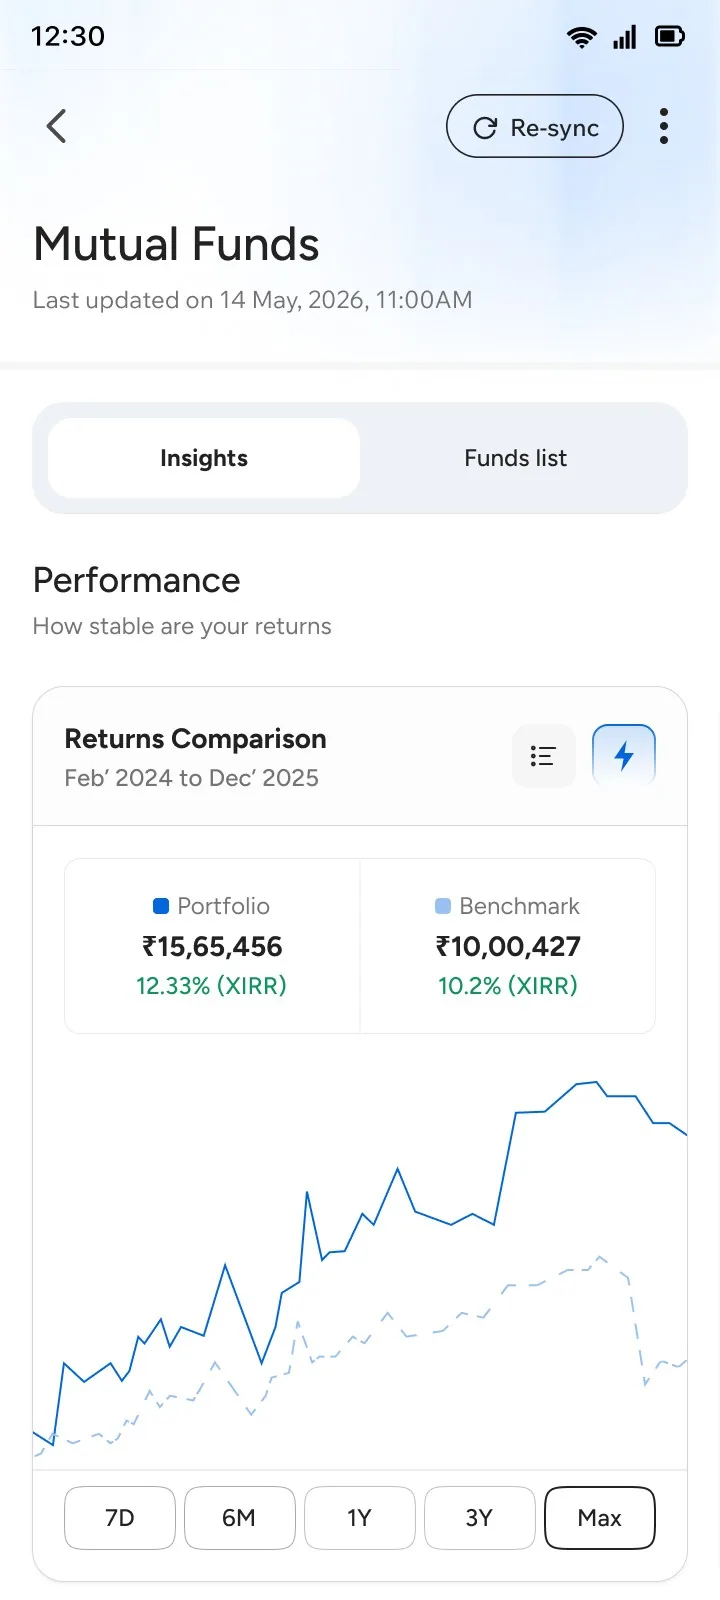
Two lines over the same time: your portfolio against its benchmark.
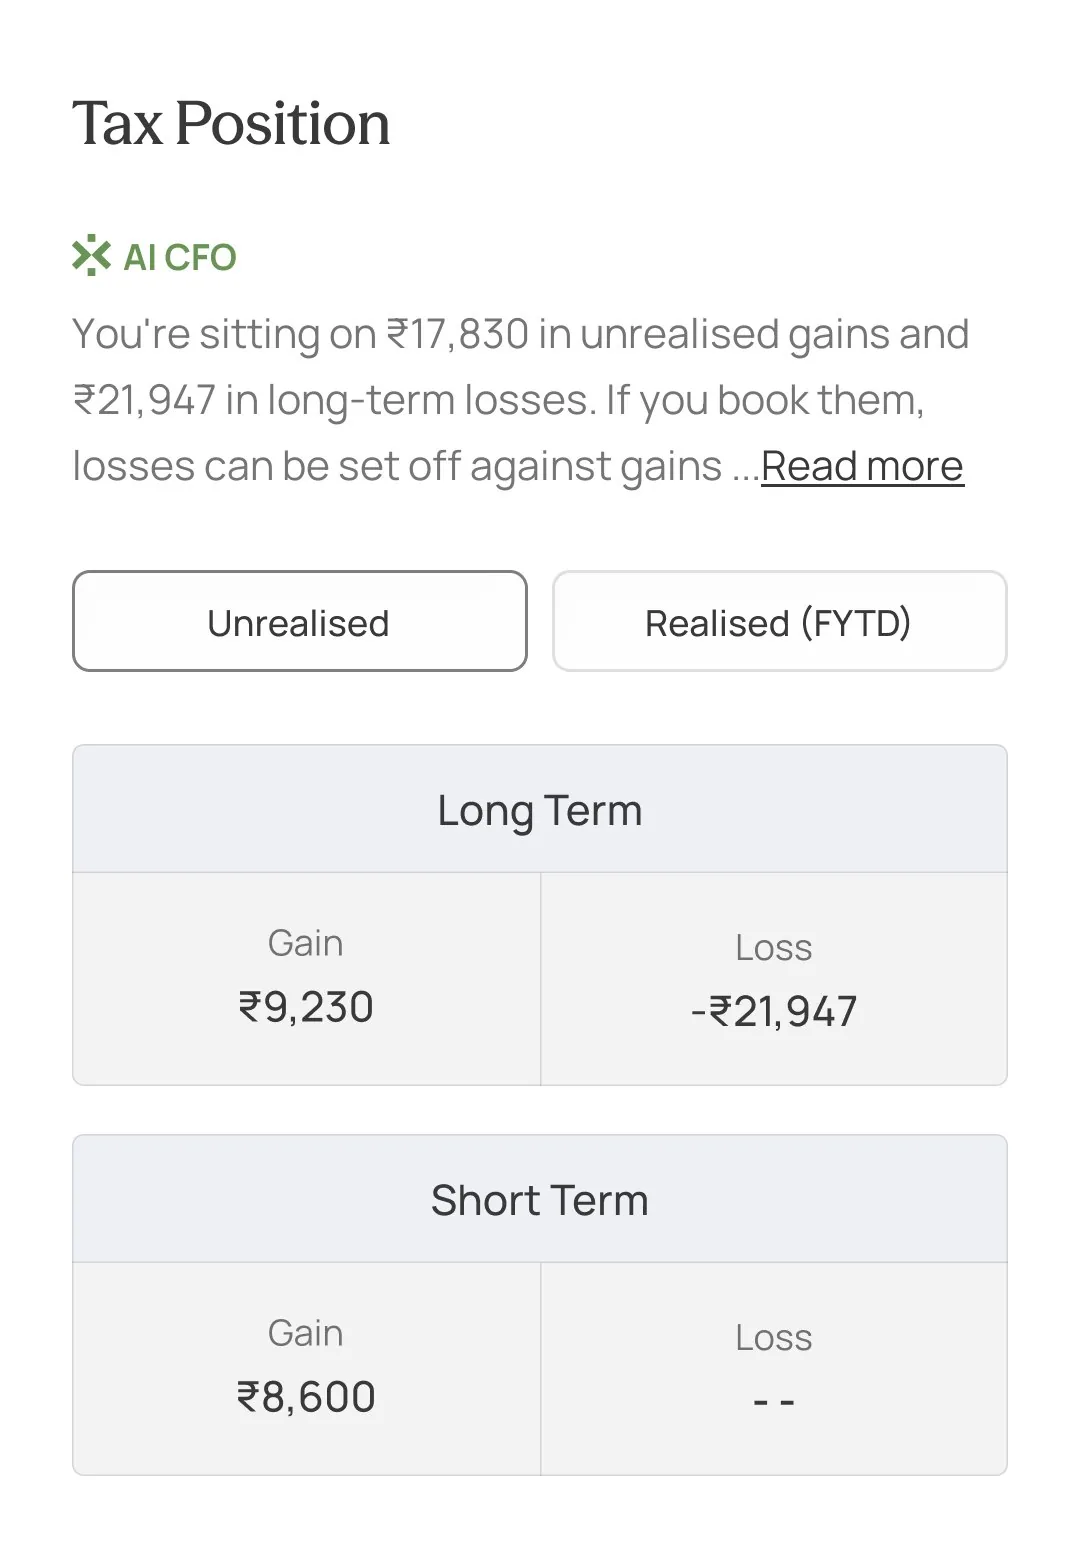
People plan tax in exact rupees. A chart would round them away.
AI inside widgets was falling while the full AI page grew. So a reading stays short, and Read more opens the full AI CFO, which answers with the same fund card, rank included.
Trade-offThe full answer lives in a chat, one tap away, not on the insights screen.


Fund data once failed to load, and readings still appeared on top of it. Now, when data is missing or updating, the reading steps back.
Trade-offSometimes people see a loading state where a reading used to be. That beats a confident wrong answer.
An app update brought 4× more readers at the same time, so I judged the redesign on rates, which growth can’t inflate.
People check their funds weekly, not daily. The next version should earn a weekly visit.
Newer cohorts drifted after week one, yet visits per weekly user rose. The gap is the second week.
People act on cost, overlap and allocation. Risk-return grades the fund manager.
One scrolling screen removed the taps we measured with. New read events should have shipped with the redesign.
The redesign and an app update landed together. A small cohort on version one would have measured the difference cleanly.
A weekly summary that opens on what changed in their funds.
Measured by · Week-2 retentionA one-tap “Was this clear?” under each reading.
Measured by · Share of readings marked clearInsights are easier to explore now. The next step is showing they’re easier to understand.
A launch wizard that shipped, then an agent that drafts whole launches while people make every call.
Just three reads I'd bring to the next planning: what I'd do differently and what comes next. Can we make the UI better? It looks very shit honestly.
Can we make the three reads that bring you to the next planning meeting, “What I Do Differently,” and “What Comes Next” UI better? It looks very shit.